
Amazon P&L Optimization
We track profitability at the SKU and account level by integrating sales, advertising, and operational costs. Through detailed reporting and analytics, we surface insights that guide smarter financial decisions.
Profit tracked where it actually lives: your P&L
Amazon dashboards report sales. Your bank account reports something else. Between the two sit referral fees, FBA fees, storage, inbound freight, returns, and ad spend — and most brands have no SKU-level view of what survives the trip.
We build and maintain that view. Every product gets a true contribution margin: what it nets after every fee and every ad dollar, updated monthly and reported at a level a CFO would sign off on. Then we work the lines nobody owns — the fee errors, the oversized cartons, the underpriced SKUs, the programs Amazon never tells you about — because that's where margin hides.
What we work on
- SKU-level P&L reporting — true contribution margin per product, monthly, with sales, fees, freight, and advertising integrated in one view
- Fee auditing & recovery — dimension re-measurements, misapplied fee classes, reimbursements, and programs like SIPP that quietly add margin
- Price & pack architecture — testing price, pack counts, and carton specs against conversion and contribution margin, not gut feel
- Decision support — which SKUs to push, fix, or retire, with the profit math already done
Why it works
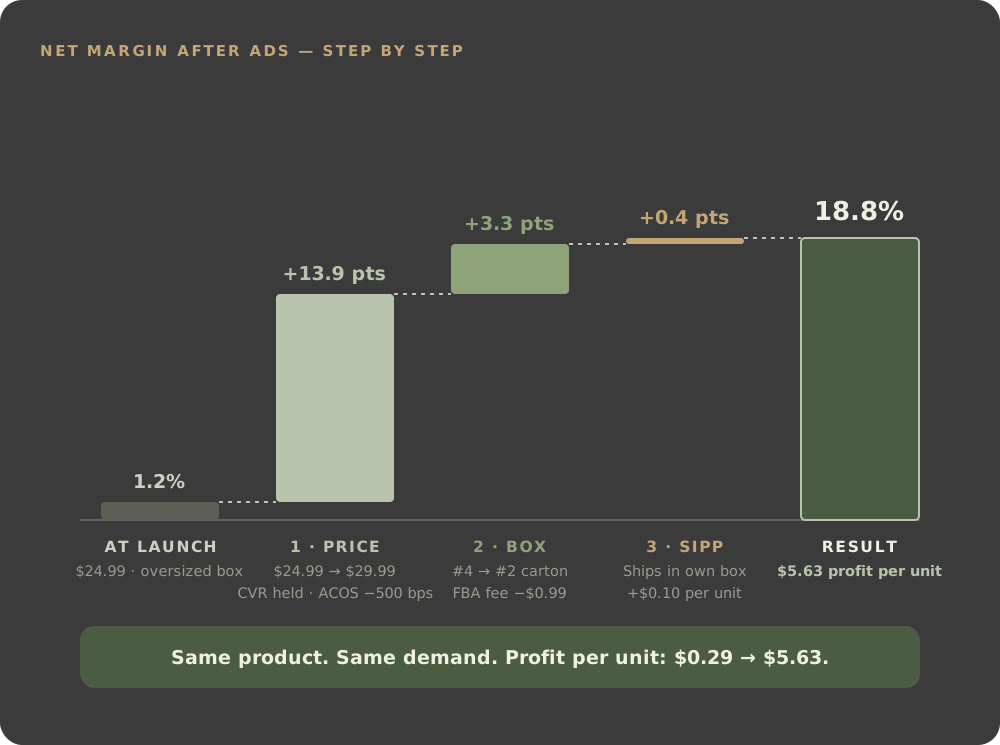
A snack brand came to us with a product the CEO wanted to kill: real demand, $0.29 of profit per unit. Three P&L moves — a price increase the data supported, a smaller carton that cut the FBA fee from $6.75 to $5.76, and enrollment in Ships in Product Packaging — took it from break-even to 18.8% net margin after ads. Same product, same demand. The margin was engineered, not discovered. That's this service.
See our work
Real engagements, real P&L numbers — see what running Amazon like a P&L actually looks like.

Let's work together
Ready to grow your Amazon channel profitably? Book a call and we'll walk through your P&L together.
%20(1).webp)