
Amazon Operations
We monitor inventory flow, forecast demand, and track operational metrics to reduce stockouts and excess. By aligning supply chain data with sales velocity, we build systems that support consistent growth.
Margin your ad agency will never find — because it isn't in the ad console
Stockouts kill rank. Overstock kills cash. Oversized cartons and small-parcel shipments kill margin a few cents at a time, invisibly, on every unit you sell. Operations is where Amazon accounts quietly leak profit — and where nobody is usually looking.
We own the unglamorous work: forecasting, replenishment, freight, and the physical details of how your product moves. It's managed as part of the same system as your advertising and pricing, because a campaign that scales demand into a stockout is a campaign that wasted its budget.
What we own
- Inventory forecasting & replenishment — automated dashboards, weekly FBA replenishment, and quarterly buying forecasts so demand spikes don't become stockouts
- FBM backup coverage — every SKU protected, so a late check-in never takes your listing dark
- Inbound freight strategy — right-sizing shipments and lanes; moving one client from small-parcel to LTL pallets cut inbound cost per unit by 60%
- Carton & dimension discipline — the box specs and re-measurements that decide your FBA fee on every single unit
Why it works
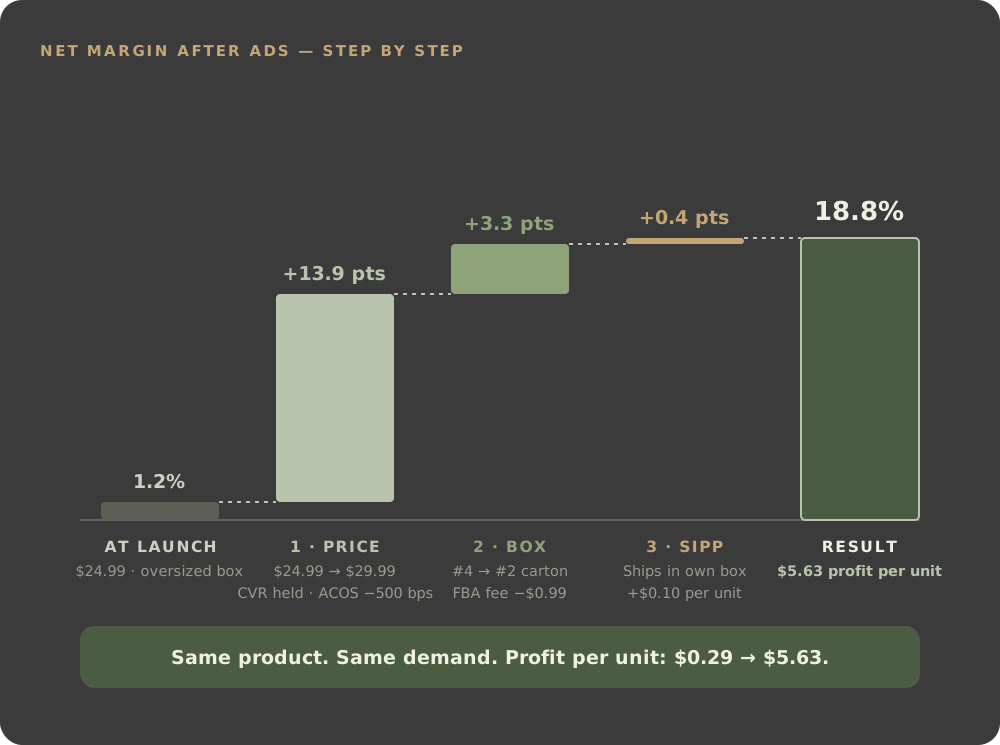
For Weatherman, operations was one of the four systems that produced 30 consecutive months of profitable growth — the 60% cut in inbound cost per unit was margin no ad optimization could ever reach. For a snack brand, a single carton change was worth 330 basis points of net margin. Cents per unit, at Amazon volume, is a P&L line.
See our work
Real engagements, real P&L numbers — see what running Amazon like a P&L actually looks like.

Let's work together
Ready to grow your Amazon channel profitably? Book a call and we'll walk through your P&L together.
%20(1).webp)